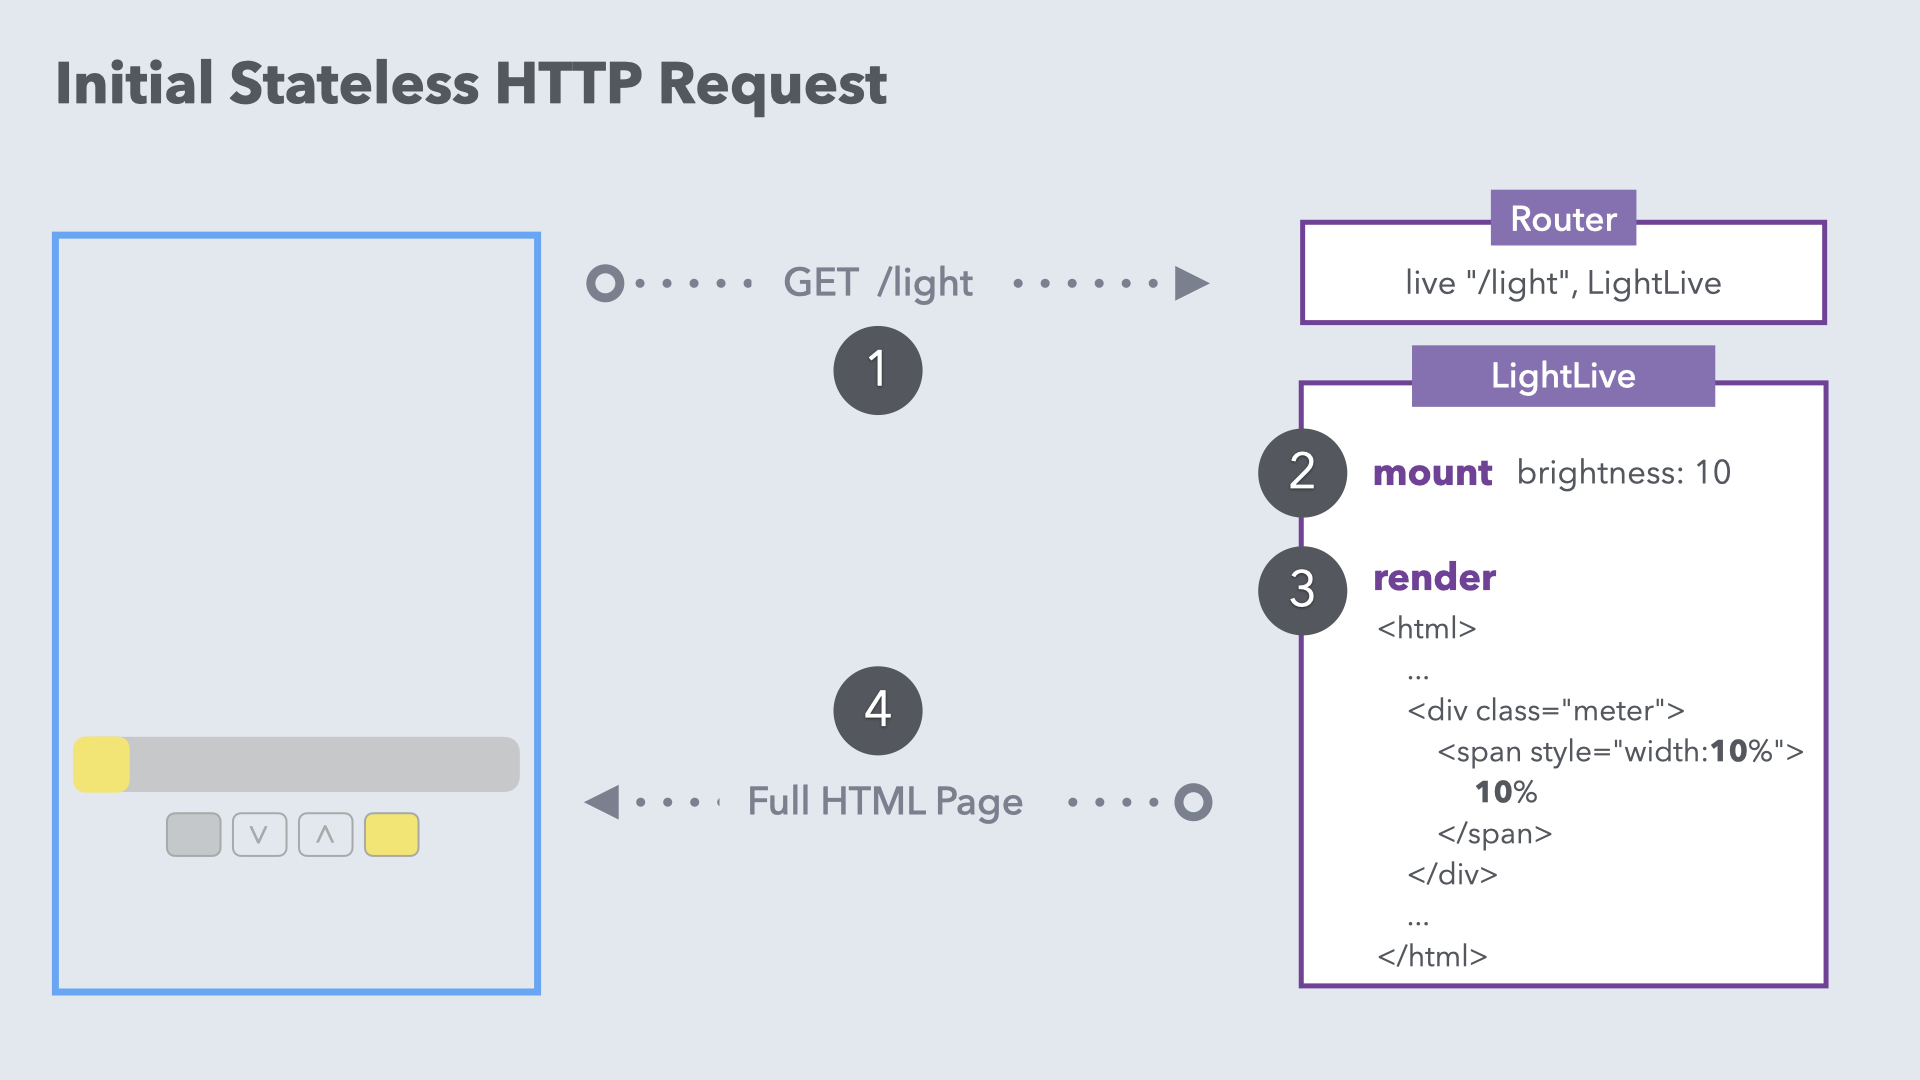
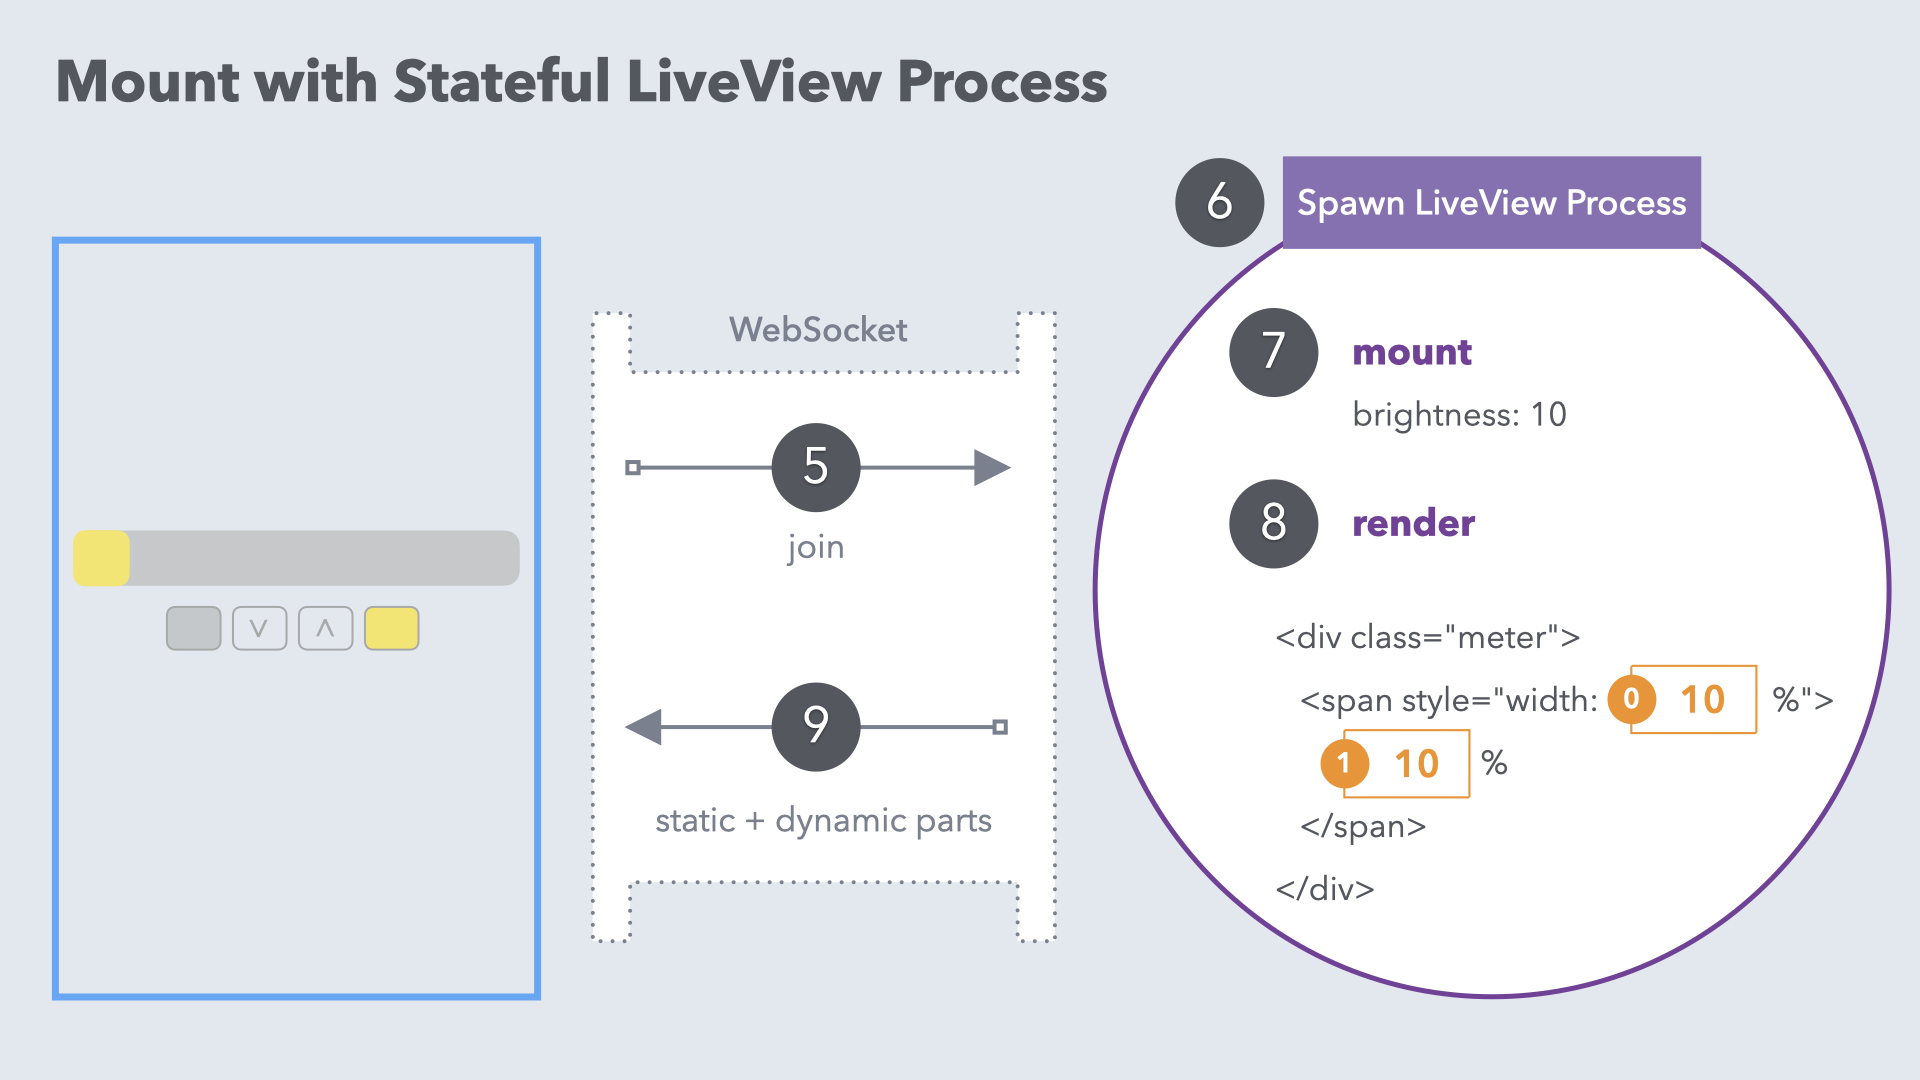
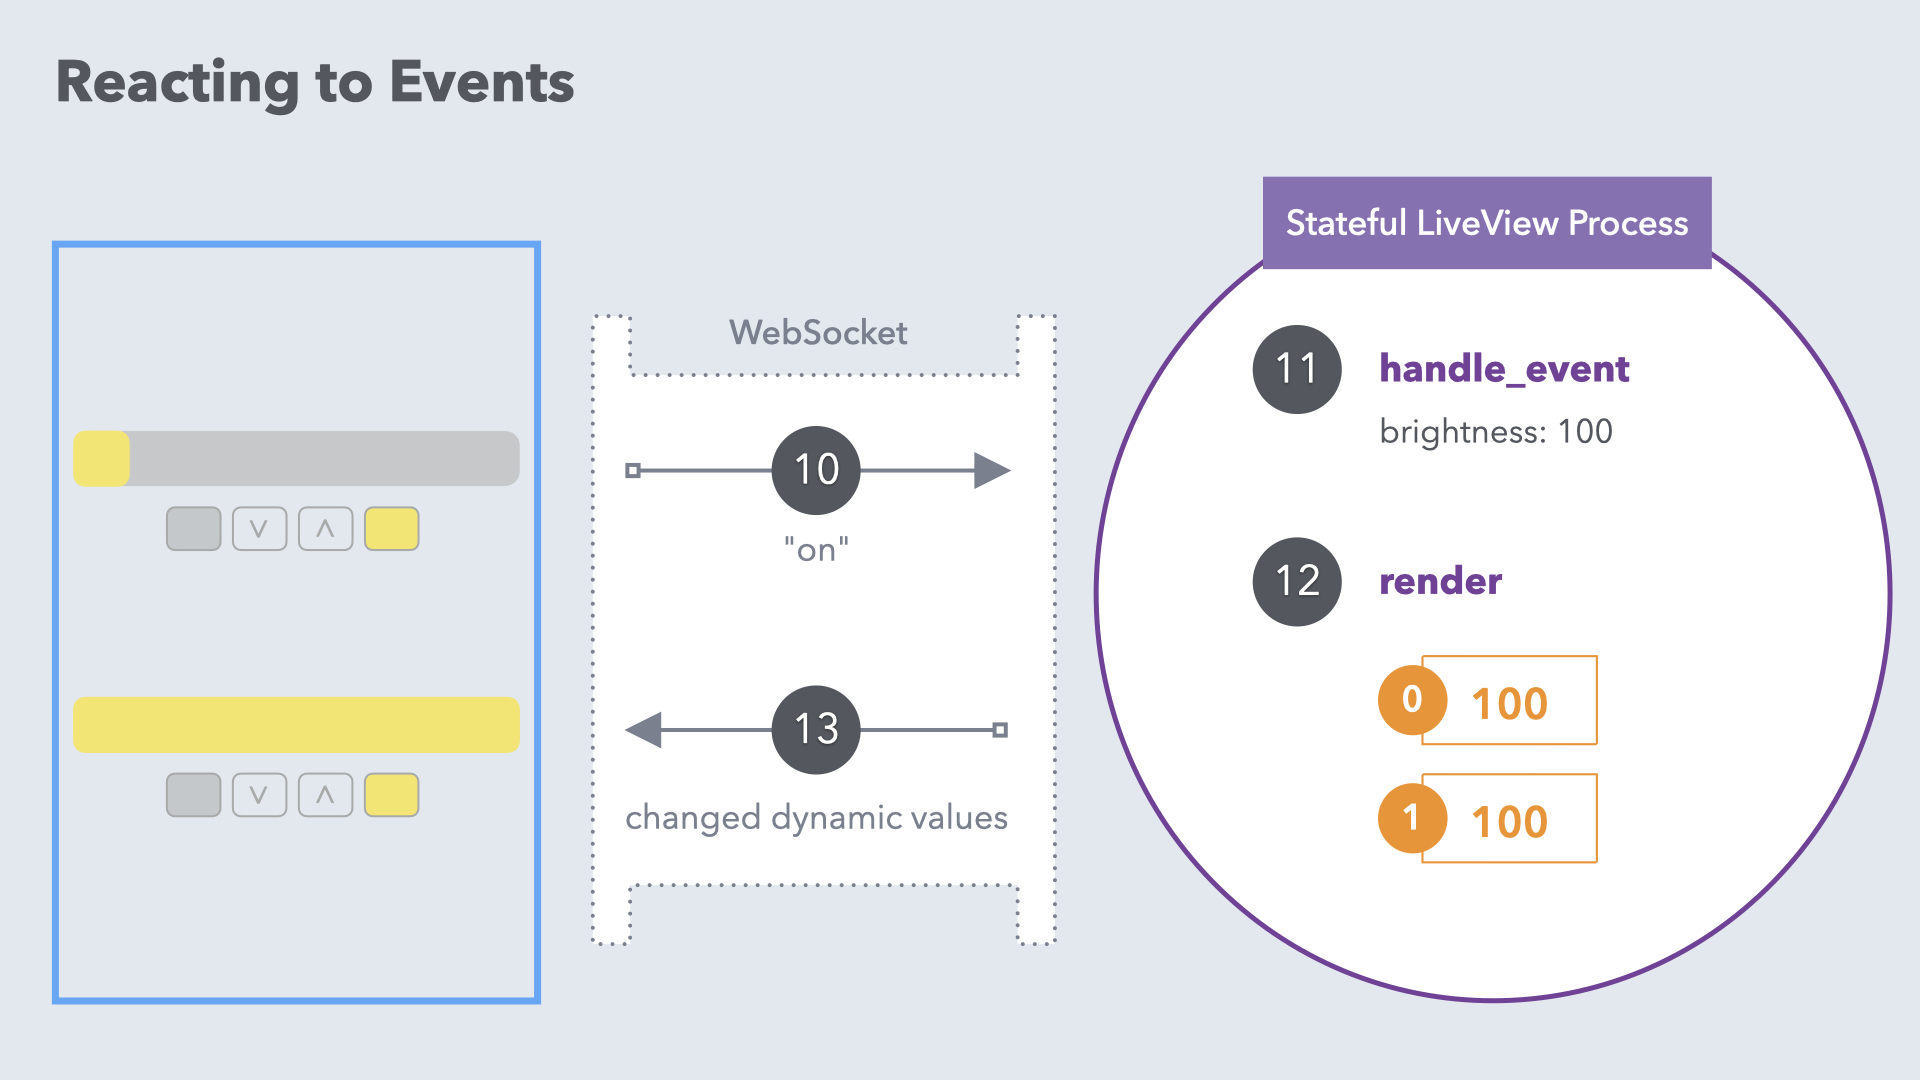
LiveView Life Cycle
Notes
Life Cycle Recap
🤔 How Will LiveView Scale?
It's a fair question, especially if you're new to the Elixir/Phoenix platform. Since each stateful LiveView runs in a separate process, depending on the number of users you could have thousands, hundreds of thousands, or even millions of processes. And all the communication happens over Websockets.
A lot of systems would buckle under these conditions, but Elixir and Phoenix are uniquely suited for it. And by riding atop this battle-tested platform, LiveView is in a league of its own.
The Road to 2 Million Websocket Connections has a lot of juicy details.
What about the memory footprint? Since each LiveView process maintains its own state on the server, you might think you'd quickly run out of memory as the number of concurrent users increased. But each LiveView process starts out consuming only 40kb of memory, which means theoretically you could support up to 25,000 concurrent LiveView processes (users) running on a 1GB server.
Of course, the actual size of each LiveView process will vary depending on how much you store in the LiveView's state. But even in a realistic application, you'd have no problem supporting many thousands of concurrent LiveView users on a very small server. And to decrease the memory footprint, LiveView has a feature called streams to manage large collections of items in the browser without keeping them in memory on the server. We'll learn about streams in an upcoming module.
In our Elixir & OTP course we start with the fundamentals of concurrent processes and work our way up to advanced topics like GenServers and Supervisors. You'll learn how Elixir and the Erlang VM (the BEAM) are unrivaled for building massively scalable applications with high availability. 🏎️
Exercise: LiveSocket Debugging
In the video we inspected the websocket network activity using the browser's built-in tools. That allowed us to look at every outgoing and incoming websocket message in great detail. 🤓
But sometimes you just want an easy way to see the diff of changes sent down the wire from the server. And LiveView has a built-in way to do that!
If you pop open the "Console" panel of your browser's developer tools and reload a LiveView page, you'll see a debug message for every lifecycle event including the static and dynamic parts that were sent over the wire from the server to the client. So it's a quick way to see the response:
Give the debugger a whirl by bumping the light up and down, and checking out the diffs for every interaction. Although LiveView does an amazing job of minimizing the diffs, it's a good idea during development to keep tabs on the payload to make sure you're avoiding known pitfalls.
Live socket debugging is enabled by default on localhost. You can disable debugging by going into the browser's "Console" panel and calling:
liveSocket.disableDebug();
And you can explicitly enable debugging using:
liveSocket.enableDebug();
When you enable debugging, a flag is dropped in the browser's sessionStorage so debugging stays enabled for the duration of the browser session.
If you're curious, the liveSocket instance is accessible in the browser's "Console" panel because at the bottom of app.js the
liveSocket instance is assigned to a window property:
window.liveSocket = liveSocket
We recommend keeping live socket debugging enabled throughout the course. It's a great way to see what LiveView does behind the scenes! 🔍


